

Schedule
L
 W

 WW
 LW

 W

 WW

 W

 WL
 WL

 LW

 WW

 WW

 L

 L


WWWLWWWWWWLWLLWWWWWLLTeam Stats
21 games- Net Rating8.282
- Offensive Rating113.273
- Defensive Rating105.062
- Pace71.792
- Effective FG%53.3%87
- Off Rebound Pct28.3%56
- Turnover Pct21.6%30
- FT Attempt Rate33.9%69
Team Stats
21 gamesCore Stats
- Net Rating8.282
- Offensive Rating113.273
- Defensive Rating105.062
- Pace71.792
- Effective FG%53.3%87
- Off Rebound Pct28.3%56
- Turnover Pct21.6%30
- FT Attempt Rate33.9%69
Results & Margin
- Win Pct66.7%
- Point Margin / Game5.9
- Points / Game81.2
- Points Allowed / Game75.3
- 1st Half Margin4.8
- 2nd Half Margin1.1
- Avg Largest Lead13.7
- Avg Largest Deficit5.4
Box Score
- Points / Game81.2
- Rebounds / Game39.4
- Assists / Game14.6
- ORebs / Game10.2
- DRebs / Game29.2
- Steals / Game6.5
- Blocks / Game3.3
- Turnovers / Game15.5
- PFs / Game16.8
Shooting
- FGMs / GamePart of the Season Pass
- FGAs / GamePart of the Season Pass
- Field Goal PctPart of the Season Pass
- 2PMs / GamePart of the Season Pass
- 2PAs / GamePart of the Season Pass
- 2-Point PctPart of the Season Pass
- 3PMs / GamePart of the Season Pass
- 3PAs / GamePart of the Season Pass
- 3-Point PctPart of the Season Pass
- FTMs / GamePart of the Season Pass
- FTAs / GamePart of the Season Pass
- Free Throw PctPart of the Season Pass
Scoring Breakdown
- % Pts from 2sPart of the Season Pass
- % Pts from 3sPart of the Season Pass
- % Pts from FTsPart of the Season Pass
- Paint Pts / GamePart of the Season Pass
- % Pts in PaintPart of the Season Pass
- Fast Break Pts / GamePart of the Season Pass
- % Pts on Fast BreakPart of the Season Pass
- Points off TOVs / GamePart of the Season Pass
- % Pts off TOVsPart of the Season Pass
- 1st Half Pts / GamePart of the Season Pass
- 2nd Half Pts / GamePart of the Season Pass
Adv Offense
- True Shooting %Part of the Season Pass
- Points / ShotPart of the Season Pass
- 3-Point Att RatePart of the Season Pass
- Assist PctPart of the Season Pass
- Assists / 100 PossPart of the Season Pass
- Ast/Tov RatioPart of the Season Pass
- PF Drawn / GamePart of the Season Pass
Opponent Shooting
- Opp Effective FG%Part of the Season Pass
- Opp True Shooting %Part of the Season Pass
- Opp Field Goal PctPart of the Season Pass
- Opp 2-Point PctPart of the Season Pass
- Opp 3-Point PctPart of the Season Pass
- Opp 3PA RatePart of the Season Pass
- Opp FT Att RatePart of the Season Pass
- Opp Points / ShotPart of the Season Pass
Defense Allowed
- Points Allowed / GamePart of the Season Pass
- Paint Pts AllowedPart of the Season Pass
- Fast Break Pts AllowedPart of the Season Pass
- Pts off TOVs AllowedPart of the Season Pass
- Opp Assist PctPart of the Season Pass
- TOVs Forced / GamePart of the Season Pass
Adv Defense
- Def Rebound PctPart of the Season Pass
- Turnovers Forced PctPart of the Season Pass
- Steal PctPart of the Season Pass
- Block PctPart of the Season Pass
- Hakeem PctPart of the Season Pass
- PF EfficiencyPart of the Season Pass
- Steals / PFPart of the Season Pass
- Blocks / PFPart of the Season Pass
Chips are national percentiles within the selected split: a team’s away numbers are ranked against every other team’s away numbers, not against the full season. Gray chips mark stats with no good direction (tempo, shot diet and the scoring shares), where the rank says how unusual a team is, not how good.
Where They Rank
of 246 D-I teams- FB Pts %Part of the Season Pass
- Opp 3P%Part of the Season Pass
- 3P%Part of the Season Pass
- TS%Part of the Season Pass
- Opp eFG%Part of the Season Pass
- 3PM DiffPart of the Season Pass
- eFG%Part of the Season Pass
- Pts DiffPart of the Season Pass
Where they rank bestof 246 D-I teams
- FB Pts %Part of the Season Pass
- Opp 3P%Part of the Season Pass
- 3P%Part of the Season Pass
- TS%Part of the Season Pass
- Opp eFG%Part of the Season Pass
- 3PM DiffPart of the Season Pass
- eFG%Part of the Season Pass
- Pts DiffPart of the Season Pass
Where they rank worstof 246 D-I teams
- Opp TOV%Part of the Season Pass
- SOSPart of the Season Pass
- Opp OREB%Part of the Season Pass
- TOV%Part of the Season Pass
- AST%Part of the Season Pass
- OREB%Part of the Season Pass
- Adj DRtgPart of the Season Pass
- REB DiffPart of the Season Pass
Schedule
Loading the schedule
 PeterKissJrCPCharlesPrideSo
 HallElisiasSr
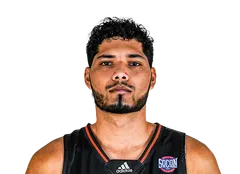 Luis HurtadoJr.Jr
NSNathanielStokesSo
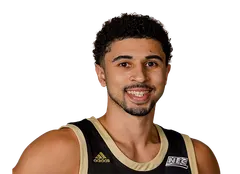 ChrisChildsJr
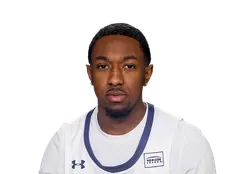 Michael GreenIIISo
 MeloEgglestonJr
TKTimmyKigginsSo
 LukeSutherlandSo
NCNickCrockerJr
KKKaiKostmayerFrJIJoe MoonIVFr
EBEricksonBansFr
| P. KissPeter Kiss | Jr | 6'5" | +0.980 | 0.888 | – | 62.6%84 | 22.5%79 | 16.6 | 6.5 | 3.2 | 42.2% | 87.0% |
| C. PrideCharles Pride | So | 6'4" | +0.878 | 0.886 | – | 61.1%81 | 19.0%58 | 13.7 | 7.0 | 2.5 | 40.9% | 77.3% |
| H. ElisiasHall Elisias | Sr | 6'8" | +0.463 | 0.466 | – | 63.9%87 | 17.3%45 | 10.3 | 7.6 | 0.3 | 20.0% | 64.6% |
| L. Hurtado Jr.Luis Hurtado Jr. | Jr | 6'6" | -0.143 | 0.249 | – | 56.5%64 | 14.6%27 | 5.2 | 4.4 | 2.7 | 44.4% | 59.0% |
| N. StokesNathaniel Stokes | So | 6'8" | -0.238 | 0.138 | – | 49.0%31 | 12.2%15 | 3.4 | 2.6 | 0.9 | 30.6% | 72.7% |
| C. ChildsChris Childs | Jr | 6'2" | -0.336 | 0.244 | – | 59.5%76 | 20.9%70 | 14.0 | 2.4 | 1.2 | 39.5% | 86.7% |
| M. Green IIIMichael Green III | So | 5'11" | -0.814 | -0.18 | – | 51.1%40 | 25.8%90 | 16.0 | 3.7 | 3.7 | 32.5% | 77.1% |
| M. EgglestonMelo Eggleston | Jr | 6'8" | – | – | – | 41.7%16 | 41.6%100 | 5.0 | 4.0 | 1.0 | 50.0% | 0.0% |
| T. KigginsTimmy Kiggins | So | 6'0" | – | – | – | 85.2%96 | 11.0%12 | 0.5 | 0.8 | 0.5 | 0.0% | 0.0% |
| L. SutherlandLuke Sutherland | So | 6'7" | – | – | – | 85.0%96 | 15.4%32 | 2.0 | 2.0 | 0.2 | 0.0% | 0.0% |
| N. CrockerNick Crocker | Jr | 6'10" | – | – | – | 150.0%100 | 18.2%52 | 3.0 | 1.7 | 0.3 | 0.0% | 0.0% |
| K. KostmayerKai Kostmayer | Fr | 6'8" | – | – | – | 90.9%97 | 17.7%48 | 4.0 | 1.8 | 0.7 | 50.0% | 0.0% |
| J. Moon IVJoe Moon IV | Fr | 6'1" | – | – | – | 88.9%97 | 19.3%60 | 1.6 | 0.2 | 0.7 | 33.3% | 0.0% |
| E. BansErickson Bans | Fr | 5'11" | – | – | – | 61.5%81 | 17.9%49 | 4.4 | 1.4 | 0.5 | 38.9% | 83.3% |
| Ratings (ADJUSTED) | Four Factors | Shooting | |||||||||||
|---|---|---|---|---|---|---|---|---|---|---|---|---|---|
  25-26 | 9-22 | #349 | -18.45 | 98.35 | 116.813 | -6.917 | -5723 | +2365 | 28.4%26 | +1062 | 47.9%9 | 30.4%7 | 74.7%76 |
| 24-2515 | 23-12 | #138 | 3.166 | 109.161 | 106.164 | -5.422 | +13382 | +1356 | 34.2%83 | -852 | 51.3%51 | 33.4%42 | 71.2%38 |
| 23-24 | 20-13 | #163 | 2.562 | 104.539 | 102.078 | -2.151 | -1557 | +3169 | 20.9%1 | -2260 | 52.3%72 | 33.9%48 | 66.9%10 |
| 22-23 | 17-13 | #167 | 1.458 | 109.374 | 107.837 | -3.629 | +15893 | +651 | 30.1%60 | +3025 | 53.2%83 | 34.0%49 | 73.4%68 |
| 21-2216 | 22-10 | #201 | -1.547 | 105.861 | 107.330 | -6.214 | +9073 | +3874 | 33.1%88 | +5517 | 50.2%47 | 30.4%9 | 73.2%66 |
| 19-20 | 15-17 | #218 | -3.241 | 99.532 | 102.749 | -5.717 | +9975 | +5079 | 31.6%80 | +749 | 48.5%28 | 32.1%31 | 67.7%21 |
| 18-19 | 10-20 | #327 | -14.57 | 100.625 | 115.12 | -5.715 | -1139 | -2231 | 26.6%31 | -451 | 49.0%22 | 32.5%23 | 71.2%56 |
| 17-18 | 3-28 | #342 | -20.32 | 99.413 | 119.70 | -4.321 | -2352 | -4915 | 26.2%23 | +839 | 47.9%11 | 34.4%41 | 70.5%39 |
| 16-17 | 12-20 | #271 | -8.423 | 102.640 | 111.013 | -4.821 | -1737 | +350 | 30.0%57 | +2434 | 49.8%37 | 33.8%33 | 71.9%68 |
| 15-16 | 7-23 | #345 | -20.31 | 93.86 | 114.24 | -5.714 | -1698 | -5313 | 26.3%17 | +748 | 47.5%19 | 32.2%19 | 64.3%5 |
| 14-15 | 16-15 | #231 | -4.536 | 102.549 | 107.024 | -3.332 | -4330 | +3477 | 29.5%29 | +3327 | 48.8%43 | 34.6%54 | 75.0%95 |
| 13-14 | 17-14 | #186 | -2.144 | 106.455 | 108.433 | -3.832 | -6924 | -4222 | 28.8%23 | -753 | 52.6%84 | 33.3%35 | 70.3%53 |
No lineup data for 20-21. Five-man units are reconstructed from the players on the floor at each play, which the play-by-play only began carrying in 2023-24.
No on/off data for 20-21. It is built from the players on the floor at each play, which the play-by-play only began carrying in 2023-24.
Teams Like
Bryant
Match On