

Schedule
L
 W

 WWL

 L

 L
 W

 L

 W

 WL

 L

 WW

 W

 L

 L

 W

 W

 WL

 W

 L

 W

 W

 LWWLLWLW

 W

 L


WWWLLLWLWWLLWWWLLWWWLWLWWLWWLLWLWWLTeam Stats
33 games- Net Rating2.763
- Offensive Rating115.268
- Defensive Rating112.544
- Pace66.362
- Effective FG%53.4%83
- Off Rebound Pct25.3%24
- Turnover Pct15.3%97
- FT Attempt Rate30.5%29
Team Stats
33 gamesCore Stats
- Net Rating2.763
- Offensive Rating115.268
- Defensive Rating112.544
- Pace66.362
- Effective FG%53.4%83
- Off Rebound Pct25.3%24
- Turnover Pct15.3%97
- FT Attempt Rate30.5%29
Results & Margin
- Win Pct51.5%
- Point Margin / Game1.8
- Points / Game76.3
- Points Allowed / Game74.5
- 1st Half Margin0.2
- 2nd Half Margin1.6
- Avg Largest Lead11.5
- Avg Largest Deficit10.6
Box Score
- Points / Game76.3
- Rebounds / Game33.4
- Assists / Game15.3
- ORebs / Game8.9
- DRebs / Game24.5
- Steals / Game5.8
- Blocks / Game1.6
- Turnovers / Game10.1
- PFs / Game17.2
Shooting
- FGMs / GamePart of the Season Pass
- FGAs / GamePart of the Season Pass
- Field Goal PctPart of the Season Pass
- 2PMs / GamePart of the Season Pass
- 2PAs / GamePart of the Season Pass
- 2-Point PctPart of the Season Pass
- 3PMs / GamePart of the Season Pass
- 3PAs / GamePart of the Season Pass
- 3-Point PctPart of the Season Pass
- FTMs / GamePart of the Season Pass
- FTAs / GamePart of the Season Pass
- Free Throw PctPart of the Season Pass
Scoring Breakdown
- % Pts from 2sPart of the Season Pass
- % Pts from 3sPart of the Season Pass
- % Pts from FTsPart of the Season Pass
- Paint Pts / GamePart of the Season Pass
- % Pts in PaintPart of the Season Pass
- Fast Break Pts / GamePart of the Season Pass
- % Pts on Fast BreakPart of the Season Pass
- Points off TOVs / GamePart of the Season Pass
- % Pts off TOVsPart of the Season Pass
- 1st Half Pts / GamePart of the Season Pass
- 2nd Half Pts / GamePart of the Season Pass
Adv Offense
- True Shooting %Part of the Season Pass
- Points / ShotPart of the Season Pass
- 3-Point Att RatePart of the Season Pass
- Assist PctPart of the Season Pass
- Assists / 100 PossPart of the Season Pass
- Ast/Tov RatioPart of the Season Pass
- PF Drawn / GamePart of the Season Pass
Opponent Shooting
- Opp Effective FG%Part of the Season Pass
- Opp True Shooting %Part of the Season Pass
- Opp Field Goal PctPart of the Season Pass
- Opp 2-Point PctPart of the Season Pass
- Opp 3-Point PctPart of the Season Pass
- Opp 3PA RatePart of the Season Pass
- Opp FT Att RatePart of the Season Pass
- Opp Points / ShotPart of the Season Pass
Defense Allowed
- Points Allowed / GamePart of the Season Pass
- Paint Pts AllowedPart of the Season Pass
- Fast Break Pts AllowedPart of the Season Pass
- Pts off TOVs AllowedPart of the Season Pass
- Opp Assist PctPart of the Season Pass
- TOVs Forced / GamePart of the Season Pass
Adv Defense
- Def Rebound PctPart of the Season Pass
- Turnovers Forced PctPart of the Season Pass
- Steal PctPart of the Season Pass
- Block PctPart of the Season Pass
- Hakeem PctPart of the Season Pass
- PF EfficiencyPart of the Season Pass
- Steals / PFPart of the Season Pass
- Blocks / PFPart of the Season Pass
Chips are national percentiles within the selected split: a team’s away numbers are ranked against every other team’s away numbers, not against the full season. Gray chips mark stats with no good direction (tempo, shot diet and the scoring shares), where the rank says how unusual a team is, not how good.
Where They Rank
of 353 D-I teams- TOV%Part of the Season Pass
- PO TOV DiffPart of the Season Pass
- 3PM DiffPart of the Season Pass
- 3P%Part of the Season Pass
- AST%Part of the Season Pass
- TS%Part of the Season Pass
- eFG%Part of the Season Pass
- Adj ORtgPart of the Season Pass
Where they rank bestof 353 D-I teams
- TOV%Part of the Season Pass
- PO TOV DiffPart of the Season Pass
- 3PM DiffPart of the Season Pass
- 3P%Part of the Season Pass
- AST%Part of the Season Pass
- TS%Part of the Season Pass
- eFG%Part of the Season Pass
- Adj ORtgPart of the Season Pass
Where they rank worstof 353 D-I teams
- Opp eFG%Part of the Season Pass
- SOSPart of the Season Pass
- Adj DRtgPart of the Season Pass
- OREB%Part of the Season Pass
- Paint Pts %Part of the Season Pass
- FB Pts %Part of the Season Pass
- REB DiffPart of the Season Pass
- FTARPart of the Season Pass
Schedule
Loading the schedule
DBDavonBellSrRCRomeoCrouchSoFLFrancoisLewisSrAFAdamFlaglerFrCMChrisMartinFr CoryHightowerFr
 JCYoungerJr
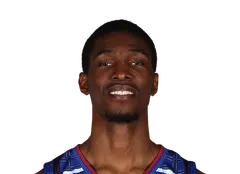 ArmelTeTeJr
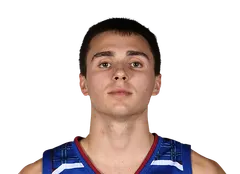 KodyShubertFr
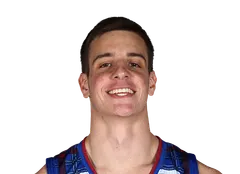 BenDrakeSr
CoryHightowerFrJCYoungerJrArmelTeTeJrJBJamieBakerSo
EKEthanKaySr
MCMaleekCatchingsSr
KodyShubertFrTBTristenBeckerJr
BenDrakeSr| D. BellDavon Bell | Sr | 5'10" | +1.591 | 1.593 | – | 52.0%39 | 20.9%70 | 10.1 | 4.2 | 6.5 | 28.2% | 75.4% |
| R. CrouchRomeo Crouch | So | 6'3" | +0.671 | 0.771 | – | 64.5%88 | 12.7%15 | 6.7 | 3.4 | 1.1 | 40.0% | 70.8% |
| F. LewisFrancois Lewis | Sr | 6'9" | +0.465 | 0.771 | – | 58.8%72 | 25.0%88 | 14.9 | 4.9 | 1.6 | 39.2% | 74.8% |
| A. FlaglerAdam Flagler | Fr | 6'3" | -0.045 | 0.557 | – | 56.8%63 | 22.7%80 | 15.9 | 3.4 | 1.3 | 38.3% | 84.1% |
| C. MartinChris Martin | Fr | 6'0" | -0.143 | 0.239 | – | 56.6%63 | 16.7%40 | 5.0 | 3.4 | 1.2 | 28.6% | 72.9% |
| C. HightowerCory Hightower | Fr | 6'7" | -0.236 | 0.342 | – | 54.0%50 | 22.2%78 | 9.4 | 6.3 | 1.9 | 34.4% | 75.8% |
| JC Younger | Jr | 6'4" | -0.430 | 0.233 | – | 60.4%78 | 16.9%42 | 9.6 | 2.6 | 0.7 | 43.9% | 64.3% |
| A. TeTeArmel TeTe | Jr | 6'9" | – | – | – | 77.6%96 | 14.9%28 | 2.5 | 2.1 | 0.1 | 0.0% | 53.8% |
| J. BakerJamie Baker | So | 5'11" | – | – | – | – | 22.1%77 | 3.7 | 1.0 | 0.4 | 0.0% | 100.0% |
| E. KayEthan Kay | Sr | 6'0" | – | – | – | 122.5%99 | 14.5%25 | 1.7 | 0.3 | 0.3 | 9.1% | 0.0% |
| M. CatchingsMaleek Catchings | Sr | 6'4" | – | – | – | – | 7.2%4 | 1.6 | 1.7 | 0.2 | 0.0% | 0.0% |
| K. ShubertKody Shubert | Fr | 5'11" | – | – | – | 59.5%74 | 18.9%56 | 3.4 | 0.9 | 1.4 | 36.1% | 75.0% |
| T. BeckerTristen Becker | Jr | 6'3" | – | – | – | – | 0.0%1 | 0.6 | 1.2 | 0.0 | 0.0% | 0.0% |
| B. DrakeBen Drake | Sr | 6'8" | – | – | – | 39.6%10 | 18.2%51 | 1.2 | 1.2 | 0.0 | 25.0% | 60.0% |
| Ratings (ADJUSTED) | Four Factors | Shooting | |||||||||||
|---|---|---|---|---|---|---|---|---|---|---|---|---|---|
  25-26 | 15-18 | #259 | -6.830 | 105.127 | 111.937 | -5.525 | +12780 | -6610 | 33.9%78 | +7211 | 52.2%56 | 32.2%23 | 68.5%15 |
| 24-25 | 14-19 | #230 | -3.243 | 107.549 | 110.734 | -4.733 | +1345 | +3169 | 29.9%45 | -5778 | 53.0%74 | 36.8%89 | 69.8%28 |
| 23-24 | 14-19 | #272 | -5.632 | 104.740 | 110.328 | -5.719 | -1537 | -1137 | 27.4%32 | -4976 | 52.7%76 | 33.4%40 | 66.3%7 |
| 22-23 | 5-27 | #342 | -14.47 | 95.55 | 109.923 | -4.125 | -443 | -3122 | 30.7%65 | +3425 | 47.6%12 | 31.0%9 | 62.5%1 |
| 21-22 | 12-20 | #265 | -7.126 | 97.615 | 104.747 | -3.342 | +13485 | -4517 | 34.1%93 | -5579 | 47.0%12 | 27.0%0 | 67.2%12 |
| 19-20 | 10-22 | #333 | -15.55 | 97.522 | 113.14 | -6.611 | +750 | -923 | 26.6%35 | +894 | 50.8%63 | 32.2%33 | 71.3%55 |
| 18-19 | 20-16 | #164 | 0.455 | 110.181 | 109.722 | -5.219 | -3136 | +9295 | 25.9%26 | -11393 | 54.1%88 | 38.1%93 | 72.8%72 |
| 17-18 | 11-21 | #329 | -13.88 | 101.728 | 115.55 | -4.421 | -9515 | +3775 | 26.5%26 | -551 | 50.4%39 | 35.8%65 | 68.6%21 |
| 16-17 | 5-25 | #349 | -26.41 | 90.51 | 117.01 | -5.416 | -7421 | -1042 | 29.2%47 | +1033 | 46.8%9 | 34.6%45 | 68.6%36 |
| 15-16 | 8-20 | #324 | -14.29 | 93.76 | 108.029 | -4.423 | -6926 | -952 | 27.4%25 | +1936 | 47.5%19 | 29.5%3 | 71.1%64 |
| 14-15 | 6-22 | #338 | -18.24 | 95.012 | 113.24 | -3.827 | -3632 | -1510 | 29.5%29 | +6612 | 48.9%46 | 32.0%22 | 65.9%19 |
| 13-14 | 4-26 | #349 | -22.21 | 95.57 | 117.71 | -6.99 | -2092 | -648 | 22.9%1 | +749 | 50.3%55 | 35.3%62 | 67.7%29 |
No lineup data for 18-19. Five-man units are reconstructed from the players on the floor at each play, which the play-by-play only began carrying in 2023-24.
No on/off data for 18-19. It is built from the players on the floor at each play, which the play-by-play only began carrying in 2023-24.
Teams Like
Presbyterian
Match On