


 W

 W

 W

 L

 WL

 W

 W

 L

 W

 W

 L

 L

 L

 L

 L
 L

 L

 LL

 L

 L

 L

 L

 LLLL

 LL

 L
Team Stats
32 games- Net Rating-6.127
- Offensive Rating98.83
- Defensive Rating104.977
- Pace68.982
- Effective FG%48.6%24
- Off Rebound Pct29.0%58
- Turnover Pct20.6%37
- FT Attempt Rate40.6%95
Team Stats
32 gamesCore Stats
- Net Rating-6.127
- Offensive Rating98.83
- Defensive Rating104.977
- Pace68.982
- Effective FG%48.6%24
- Off Rebound Pct29.0%58
- Turnover Pct20.6%37
- FT Attempt Rate40.6%95
Results & Margin
- Win Pct28.1%14
- Point Margin / Game-4.226
- Points / Game68.123
- Points Allowed / Game72.348
- 1st Half Margin-2.228
- 2nd Half Margin-2.029
- Avg Largest Lead9.743
- Avg Largest Deficit14.417
Box Score
- Points / Game68.123
- Rebounds / Game35.559
- Assists / Game11.621
- ORebs / Game10.257
- DRebs / Game25.357
- Steals / Game4.810
- Blocks / Game3.973
- Turnovers / Game14.218
- PFs / Game17.851
Shooting
- FGMs / Game23.011
- FGAs / Game54.715
- Field Goal Pct42.1%22
- 2PMs / Game15.816
- 2PAs / Game31.612
- 2-Point Pct50.0%47
- 3PMs / Game7.237
- 3PAs / Game23.163
- 3-Point Pct31.1%11
- FTMs / Game14.977
- FTAs / Game22.289
- Free Throw Pct67.3%17
Scoring Breakdown
- % Pts from 2s46.4%24
- % Pts from 3s31.7%47
- % Pts from FTs21.9%91
- Paint Pts / Game20.847
- % Pts in Paint30.5%54
- Fast Break Pts / Game4.543
- % Pts on Fast Break6.7%47
- Points off TOVs / Game8.619
- % Pts off TOVs12.6%22
- 1st Half Pts / Game32.334
- 2nd Half Pts / Game35.622
Adv Offense
- True Shooting %52.9%28
- Points / Shot1.2552
- 3-Point Att Rate42.2%75
- Assist Pct50.4%36
- Assists / 100 Poss16.87
- Ast/Tov Ratio0.82x13
- PF Drawn / Game18.770
Opponent Shooting
- Opp Effective FG%49.5%67
- Opp True Shooting %53.6%64
- Opp Field Goal Pct43.3%64
- Opp 2-Point Pct48.0%79
- Opp 3-Point Pct34.9%42
- Opp 3PA Rate35.6%79
- Opp FT Att Rate33.3%44
- Opp Points / Shot1.2362
Defense Allowed
- Points Allowed / Game72.348
- Paint Pts Allowed19.364
- Fast Break Pts Allowed3.283
- Pts off TOVs Allowed10.363
- Opp Assist Pct47.2%83
- TOVs Forced / Game11.315
Adv Defense
- Def Rebound Pct70.7%36
- Turnovers Forced Pct16.4%6
- Steal Pct7.0%4
- Block Pct5.7%63
- Hakeem Pct12.7%21
- PF Efficiency0.95x67
- Steals / PF0.27x10
- Blocks / PF0.22x73
Chips are national percentiles within the selected split: a team’s away numbers are ranked against every other team’s away numbers, not against the full season. Gray chips mark stats with no good direction (tempo, shot diet and the scoring shares), where the rank says how unusual a team is, not how good.
Where They Rank
of 353 D-I teams- #20FTAR40.6%
- #52Paint Pts %44.5%
- #56SOS8.0
- #120Opp eFG%49.5%
- #138Adj DRtg102.7
- #152OREB%29.0%
- #154FB Pts %9.7%
- #165REB Diff+4
- #20FTAR40.6%
- #52Paint Pts %44.5%
- #56SOS8.0
- #120Opp eFG%49.5%
- #138Adj DRtg102.7
- #152OREB%29.0%
- #154FB Pts %9.7%
- #165REB Diff+4
- #3153P%31.1%
- #303Opp TOV%16.5%
- #292TOV%20.6%
- #269eFG%48.6%
- #267Pts Diff-135
- #263TS%52.2%
- #227Opp OREB%29.3%
- #226AST%50.4%
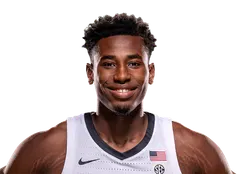
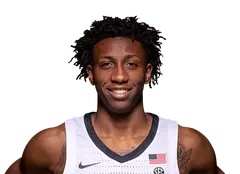


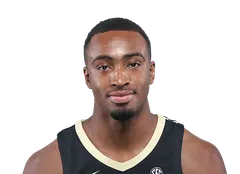
| D. GarlandDarius Garland | Fr | 6'2" | +0.878 | 0.232 | – | 66.3%90 | 26.9%93 | 16.2 | 3.8 | 2.6 | 47.8% | 75.0% |
| A. NesmithAaron Nesmith | Fr | 6'6" | +0.775 | 0.980 | – | 54.1%50 | 19.8%63 | 11.0 | 5.5 | 1.4 | 33.7% | 82.5% |
| S. LeeSaben Lee | So | 6'2" | +0.774 | 1.083 | – | 56.8%64 | 22.7%80 | 12.7 | 3.3 | 3.8 | 36.2% | 67.5% |
| Y. WetzellYanni Wetzell | Jr | 6'10" | +0.466 | 0.558 | – | 58.3%70 | 18.2%51 | 5.9 | 3.8 | 0.3 | 26.5% | 76.3% |
| C. BrownClevon Brown | Jr | 6'8" | +0.362 | 0.452 | – | 49.8%30 | 13.3%19 | 3.3 | 2.8 | 0.5 | 14.3% | 45.7% |
| M. RyanMatt Ryan | Jr | 6'8" | +0.150 | 0.453 | – | 50.4%32 | 17.1%43 | 8.1 | 2.7 | 0.9 | 32.8% | 75.0% |
| J. ToyeJoe Toye | Sr | 6'7" | -0.144 | 0.349 | – | 48.5%25 | 16.8%41 | 6.9 | 2.7 | 0.7 | 28.2% | 68.4% |
| S. ShittuSimi Shittu | Fr | 6'10" | -0.333 | 0.238 | – | 50.5%33 | 26.7%93 | 10.9 | 6.7 | 1.8 | 5.6% | 57.6% |
| M. MoyerMatthew Moyer | So | 6'8" | – | – | – | 46.4%20 | 18.0%49 | 3.8 | 3.1 | 0.6 | 24.5% | 71.1% |
| M. EvansMaxwell Evans | So | 6'2" | – | – | – | 51.3%35 | 18.2%51 | 3.8 | 1.4 | 1.2 | 30.8% | 63.4% |
| I. RiceIsaiah Rice | So | 5'11" | – | – | – | – | 9.6%7 | 0.0 | 0.0 | 0.0 | 0.0% | 0.0% |
| M. HuntMac Hunt | Fr | 6'6" | – | – | – | 125.0%99 | 14.2%24 | 1.3 | 0.0 | 0.3 | 100.0% | 0.0% |
| Ratings (ADJUSTED) | Four Factors | Shooting | |||||||||||
|---|---|---|---|---|---|---|---|---|---|---|---|---|---|
  25-265 | 27-9 | #12 | 24.897 | 125.798 | 100.891 | 12.595 | +1444 | +8491 | 31.2%50 | -10892 | 55.3%90 | 35.6%75 | 78.9%99 |
| 24-2510 | 20-13 | #51 | 14.687 | 117.691 | 103.177 | 10.890 | -140 | +1356 | 31.6%61 | -12496 | 51.6%55 | 32.5%26 | 74.6%75 |
| 23-24 | 9-23 | #212 | -3.839 | 104.337 | 108.141 | 8.788 | -8816 | -696 | 28.2%39 | -1456 | 45.4%3 | 28.3%1 | 70.9%37 |
| 22-23 | 22-15 | #93 | 7.575 | 112.286 | 104.758 | 9.195 | -2834 | +6285 | 30.8%66 | +1836 | 49.6%30 | 33.6%41 | 71.2%43 |
| 21-22 | 19-17 | #67 | 11.582 | 107.773 | 96.289 | 8.991 | -2238 | +7690 | 27.5%41 | -4470 | 50.2%46 | 34.0%52 | 69.7%31 |
| 19-20 | 11-21 | #169 | -0.150 | 104.763 | 104.834 | 6.381 | -12111 | +4777 | 25.4%22 | -2564 | 50.2%53 | 33.3%48 | 69.7%38 |
| 18-19 | 9-23 | #172 | -0.451 | 102.736 | 103.162 | 8.085 | +445 | -444 | 29.0%53 | +925 | 48.6%20 | 31.1%9 | 67.3%15 |
| 17-18 | 12-20 | #102 | 6.071 | 114.287 | 108.237 | 10.798 | +646 | +7993 | 28.6%47 | +6312 | 51.8%57 | 35.3%55 | 74.3%82 |
| 16-179 | 19-16 | #45 | 13.887 | 111.084 | 97.287 | 11.697 | 043 | +12098 | 24.8%11 | +5120 | 52.1%68 | 37.6%82 | 77.7%98 |
| 15-1611 | 19-14 | #24 | 18.893 | 113.491 | 94.695 | 9.193 | +3757 | +9095 | 27.2%23 | +6013 | 52.9%85 | 38.2%90 | 69.5%47 |
| 14-15 | 20-14 | #45 | 12.386 | 112.492 | 100.167 | 5.480 | +6468 | +3977 | 32.3%62 | +4522 | 54.4%93 | 39.2%95 | 70.8%68 |
| 13-14 | 15-16 | #130 | 3.162 | 103.539 | 100.480 | 6.783 | -5029 | +1057 | 29.9%32 | +836 | 49.1%41 | 31.9%16 | 65.8%13 |
Loading shot locations…
Shot Clock
14 gamesFill is this team's shooting against the D-I average for that stretch of the clock. On the defensive dial, green means opponents shot worse. The dashed arc is where D-I's own share of shots sits on the same scale. Points per shot excludes free throws.
No lineup data for 18-19. Five-man units are reconstructed from the players on the floor at each play, which the play-by-play only began carrying in 2023-24.
No on/off data for 18-19. It is built from the players on the floor at each play, which the play-by-play only began carrying in 2023-24.