


 W

 L

 W

 L

 W

 L

 L

 L
 L

 L

 LW

 L

 L

 WLL

 LW

 L

 W

 LW

 L
Team Stats
25 games- Net Rating-0.948
- Offensive Rating108.757
- Defensive Rating109.642
- Pace66.048
- Effective FG%51.2%68
- Off Rebound Pct28.3%56
- Turnover Pct21.0%40
- FT Attempt Rate32.9%60
Team Stats
25 gamesCore Stats
- Net Rating-0.948
- Offensive Rating108.757
- Defensive Rating109.642
- Pace66.048
- Effective FG%51.2%68
- Off Rebound Pct28.3%56
- Turnover Pct21.0%40
- FT Attempt Rate32.9%60
Results & Margin
- Win Pct36.0%27
- Point Margin / Game-0.648
- Points / Game71.861
- Points Allowed / Game72.436
- 1st Half Margin-2.232
- 2nd Half Margin1.670
- Avg Largest Lead9.847
- Avg Largest Deficit12.430
Box Score
- Points / Game71.861
- Rebounds / Game33.732
- Assists / Game12.744
- ORebs / Game9.955
- DRebs / Game23.824
- Steals / Game7.072
- Blocks / Game2.631
- Turnovers / Game13.837
- PFs / Game17.646
Shooting
- FGMs / Game24.435
- FGAs / Game56.635
- Field Goal Pct43.0%38
- 2PMs / Game15.05
- 2PAs / Game30.04
- 2-Point Pct50.2%58
- 3PMs / Game9.393
- 3PAs / Game26.794
- 3-Point Pct34.9%68
- FTMs / Game13.765
- FTAs / Game18.656
- Free Throw Pct73.6%77
Scoring Breakdown
- % Pts from 2s41.9%2
- % Pts from 3s39.0%94
- % Pts from FTs19.1%62
- Paint Pts / Game22.378
- % Pts in Paint31.1%73
- Fast Break Pts / Game5.050
- % Pts on Fast Break7.0%47
- Points off TOVs / Game11.444
- % Pts off TOVs15.9%39
- 1st Half Pts / Game32.140
- 2nd Half Pts / Game39.686
Adv Offense
- True Shooting %55.3%73
- Points / Shot1.2775
- 3-Point Att Rate47.1%96
- Assist Pct52.2%55
- Assists / 100 Poss19.343
- Ast/Tov Ratio0.92x42
- PF Drawn / Game17.656
Opponent Shooting
- Opp Effective FG%52.1%26
- Opp True Shooting %55.8%24
- Opp Field Goal Pct45.8%25
- Opp 2-Point Pct52.9%20
- Opp 3-Point Pct33.8%50
- Opp 3PA Rate37.3%50
- Opp FT Att Rate33.7%34
- Opp Points / Shot1.2823
Defense Allowed
- Points Allowed / Game72.436
- Paint Pts Allowed25.014
- Fast Break Pts Allowed6.927
- Pts off TOVs Allowed11.456
- Opp Assist Pct52.6%45
- TOVs Forced / Game13.868
Adv Defense
- Def Rebound Pct71.4%43
- Turnovers Forced Pct20.9%66
- Steal Pct10.6%70
- Block Pct3.9%28
- Hakeem Pct14.5%51
- PF Efficiency1.00x50
- Steals / PF0.40x69
- Blocks / PF0.15x33
Chips are national percentiles within the selected split: a team’s away numbers are ranked against every other team’s away numbers, not against the full season. Gray chips mark stats with no good direction (tempo, shot diet and the scoring shares), where the rank says how unusual a team is, not how good.
Where They Rank
of 347 D-I teams- #233PM Diff+55
- #70SOS6.6
- #81Adj ORtg107.5
- #93TS%54.8%
- #110eFG%51.2%
- #1133P%34.9%
- #116Opp TOV%20.0%
- #138FTAR32.9%
- #233PM Diff+55
- #70SOS6.6
- #81Adj ORtg107.5
- #93TS%54.8%
- #110eFG%51.2%
- #1133P%34.9%
- #116Opp TOV%20.0%
- #138FTAR32.9%
- #258Opp eFG%52.1%
- #219TOV%20.1%
- #209Paint Pts %36.9%
- #203REB Diff-24
- #199Opp OREB%28.6%
- #191FB Pts %9.8%
- #183Pts Diff-15
- #177Adj DRtg102.7
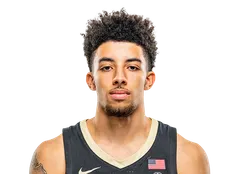 Scotty PippenJr.SoDDDylanDisuSoMEMaxwellEvansSr
 JordanWrightSo
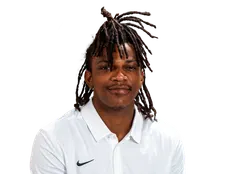 TreyThomasFr
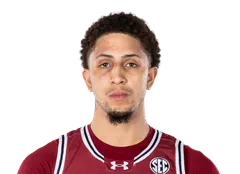 MylesStuteFr
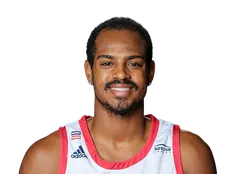 DJHarveySr
 ClevonBrownSr
 EjikeObinnaSr
 QuentinMillora-BrownJrIMIssacMcBrideFr
| S. Pippen Jr.Scotty Pippen Jr. | So | 6'1" | +1.997 | 1.396 | – | 58.4%72 | 35.1%99 | 20.8 | 2.8 | 4.9 | 35.8% | 85.0% |
| D. DisuDylan Disu | So | 6'9" | +1.492 | 0.887 | – | 59.9%77 | 23.1%81 | 15.0 | 9.2 | 1.4 | 36.9% | 73.6% |
| M. EvansMaxwell Evans | Sr | 6'2" | +0.981 | 0.784 | – | 55.6%60 | 16.9%42 | 8.5 | 3.2 | 1.7 | 35.4% | 53.1% |
| J. WrightJordan Wright | So | 6'5" | +0.980 | 0.680 | – | 56.1%62 | 21.4%73 | 8.7 | 4.5 | 2.1 | 43.2% | 64.6% |
| T. ThomasTrey Thomas | Fr | 5'11" | +0.361 | 0.359 | – | 52.5%46 | 17.4%45 | 6.0 | 1.4 | 0.9 | 39.8% | 72.2% |
| M. StuteMyles Stute | Fr | 6'7" | +0.258 | 0.247 | – | 46.6%24 | 16.4%39 | 3.9 | 2.3 | 0.5 | 28.6% | 76.0% |
| DJ Harvey | Sr | 6'6" | +0.255 | 0.354 | – | 52.5%46 | 17.4%45 | 6.3 | 2.9 | 0.5 | 36.8% | 88.9% |
| C. BrownClevon Brown | Sr | 6'8" | +0.152 | 0.244 | – | 52.7%47 | 11.1%12 | 3.4 | 2.9 | 0.3 | 18.8% | 50.0% |
| E. ObinnaEjike Obinna | Sr | 6'10" | – | – | – | 52.3%45 | 14.6%27 | 1.9 | 1.9 | 0.0 | 0.0% | 80.0% |
| I. RiceIsaiah Rice | Sr | 5'11" | – | – | – | 0.0%2 | 4.5%4 | 0.0 | 0.0 | 0.1 | 0.0% | 0.0% |
| Q. Millora-BrownQuentin Millora-Brown | Jr | 6'10" | – | – | – | 65.2%88 | 12.8%18 | 3.1 | 3.2 | 0.6 | 0.0% | 35.3% |
| I. McBrideIssac McBride | Fr | 6'1" | – | – | – | 54.2%54 | 18.7%55 | 4.7 | 1.1 | 0.7 | 35.8% | 89.5% |
| B. AlbertBraelee Albert | So | 6'5" | – | – | – | 32.0%8 | 8.2%7 | 1.1 | 1.8 | 0.5 | 22.2% | 100.0% |
| D. WeikertDrew Weikert | Jr | 6'0" | – | – | – | 33.3%9 | 19.2%59 | 1.0 | 1.5 | 1.0 | 0.0% | 0.0% |
| A. OdusipeAkeem Odusipe | Fr | 6'9" | – | – | – | 38.1%12 | 16.8%41 | 0.5 | 1.2 | 0.2 | 0.0% | 0.0% |
| T. LawrenceTyrin Lawrence | Fr | 6'4" | – | – | – | 51.8%43 | 15.1%30 | 2.9 | 2.3 | 1.3 | 0.0% | 66.7% |
| M. AdelmanMax Adelman | Fr | 6'5" | – | – | – | – | 0.0%2 | 0.0 | 0.0 | 0.0 | 0.0% | 0.0% |
| Ratings (ADJUSTED) | Four Factors | Shooting | |||||||||||
|---|---|---|---|---|---|---|---|---|---|---|---|---|---|
  25-265 | 27-9 | #12 | 24.897 | 125.798 | 100.891 | 12.595 | +1444 | +8491 | 31.2%50 | -10892 | 55.3%90 | 35.6%75 | 78.9%99 |
| 24-2510 | 20-13 | #51 | 14.687 | 117.691 | 103.177 | 10.890 | -140 | +1356 | 31.6%61 | -12496 | 51.6%55 | 32.5%26 | 74.6%75 |
| 23-24 | 9-23 | #212 | -3.839 | 104.337 | 108.141 | 8.788 | -8816 | -696 | 28.2%39 | -1456 | 45.4%3 | 28.3%1 | 70.9%37 |
| 22-23 | 22-15 | #93 | 7.575 | 112.286 | 104.758 | 9.195 | -2834 | +6285 | 30.8%66 | +1836 | 49.6%30 | 33.6%41 | 71.2%43 |
| 21-22 | 19-17 | #67 | 11.582 | 107.773 | 96.289 | 8.991 | -2238 | +7690 | 27.5%41 | -4470 | 50.2%46 | 34.0%52 | 69.7%31 |
| 19-20 | 11-21 | #169 | -0.150 | 104.763 | 104.834 | 6.381 | -12111 | +4777 | 25.4%22 | -2564 | 50.2%53 | 33.3%48 | 69.7%38 |
| 18-19 | 9-23 | #172 | -0.451 | 102.736 | 103.162 | 8.085 | +445 | -444 | 29.0%53 | +925 | 48.6%20 | 31.1%9 | 67.3%15 |
| 17-18 | 12-20 | #102 | 6.071 | 114.287 | 108.237 | 10.798 | +646 | +7993 | 28.6%47 | +6312 | 51.8%57 | 35.3%55 | 74.3%82 |
| 16-179 | 19-16 | #45 | 13.887 | 111.084 | 97.287 | 11.697 | 043 | +12098 | 24.8%11 | +5120 | 52.1%68 | 37.6%82 | 77.7%98 |
| 15-1611 | 19-14 | #24 | 18.893 | 113.491 | 94.695 | 9.193 | +3757 | +9095 | 27.2%23 | +6013 | 52.9%85 | 38.2%90 | 69.5%47 |
| 14-15 | 20-14 | #45 | 12.386 | 112.492 | 100.167 | 5.480 | +6468 | +3977 | 32.3%62 | +4522 | 54.4%93 | 39.2%95 | 70.8%68 |
| 13-14 | 15-16 | #130 | 3.162 | 103.539 | 100.480 | 6.783 | -5029 | +1057 | 29.9%32 | +836 | 49.1%41 | 31.9%16 | 65.8%13 |
Loading shot locations…
Shot Clock
13 gamesFill is this team's shooting against the D-I average for that stretch of the clock. On the defensive dial, green means opponents shot worse. The dashed arc is where D-I's own share of shots sits on the same scale. Points per shot excludes free throws.
No lineup data for 20-21. Five-man units are reconstructed from the players on the floor at each play, which the play-by-play only began carrying in 2023-24.
No on/off data for 20-21. It is built from the players on the floor at each play, which the play-by-play only began carrying in 2023-24.